
U.S. Exceptionalism, Qualified
Author: Rohit Sah, PhD
Published: August 18, 2025
Explaining the US Stock Market vs the US Economy
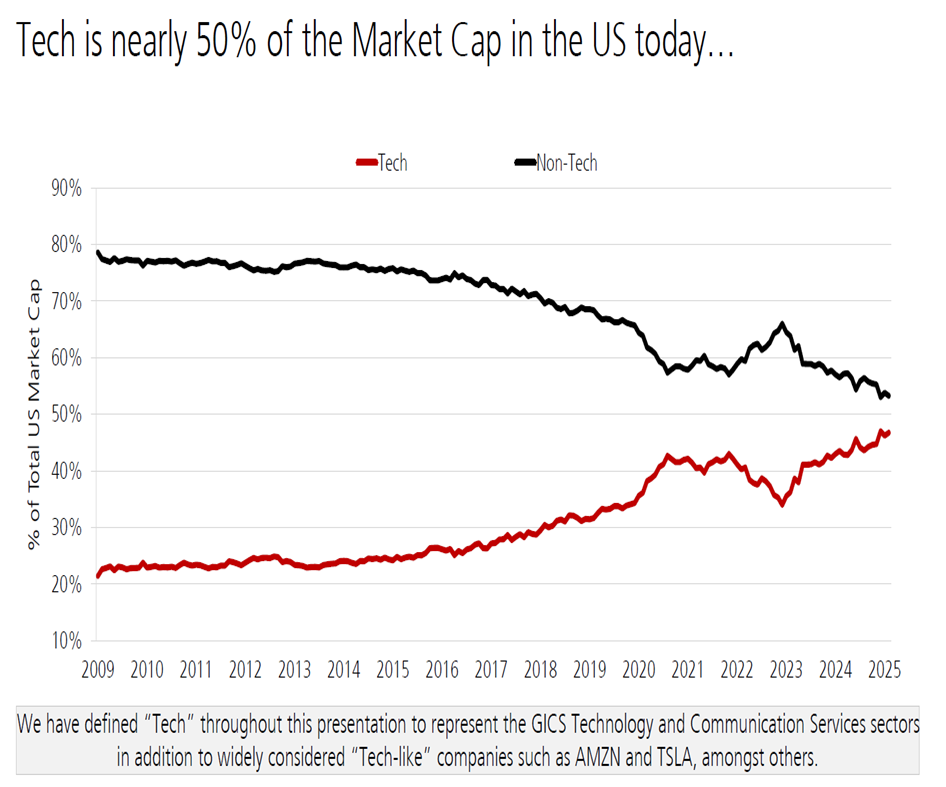
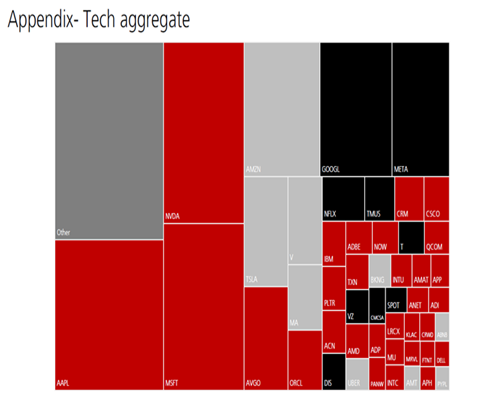
US equity markets have evolved over the last 15 years, so that now, it is half Tech+, and the other half are decidedly old economy companies. Tech+ companies comprise not just Information Technology and Communication Services (like Google & Meta), but also companies which are otherwise classified as Consumer Discretionary (like Amazon, Tesla), Industrials (Uber), Financials (PayPal, Visa, Mastercard). A pictorial representation of US Tech+ companies is shown in the two charts below, created by UBS.
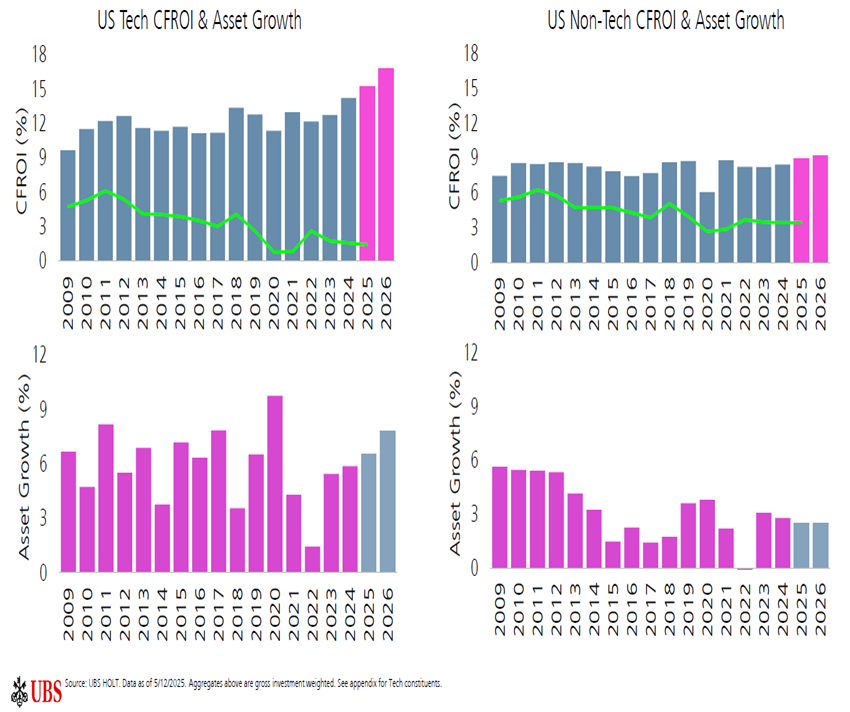
Below are the returns on capital (UBS brands it CFROI) and balance sheet growth rates for US Tech+ companies as well as their US non-Tech peers. The cost of capital comes in around 6% so with CFROI over 15%, US Tech+ earns far higher returns on capital than their old economy peers whose CFROI barely get to 8%.
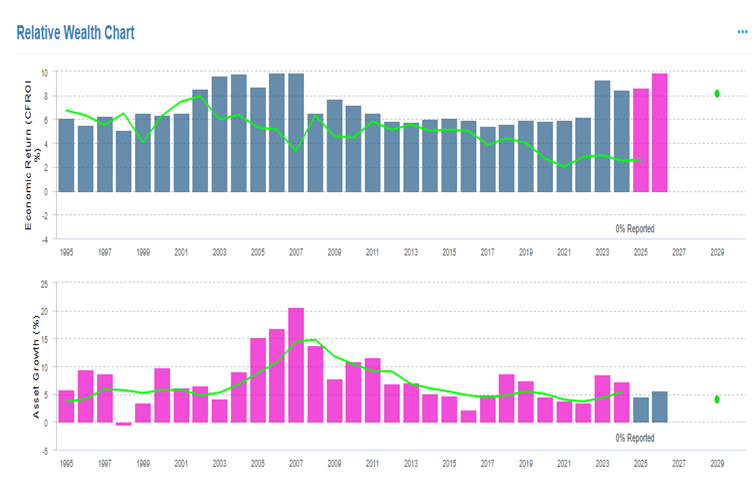
How does this compare to other countries? The only country to come anywhere close to the US in the last 10 years has been the Bombay Stock Market. But even Indian stocks come nowhere close to matching the US Tech+ universe on a fundamental basis. Below shows returns on capital and balance sheet growth for India. With a CFROI of 9% and asset growth of only 5%, India has fallen well behind the US Tech+ segment.
Even the Indian Equity Market Lags US Tech+ in profitability and growth
Where does the US Tech+ edge come from? Think in terms of a DuPont breakdown on returns: margin, sales/asset and asset/equity ratios. US Tech+ excel in each of them. Gross margins are high and sustainable. This is because of several factors like high switching costs (think Microsoft), Brand (Apple), Network effects (Meta), and proprietary technology (Google search). They are mostly asset light companies, so sales/asset and asset/equity ratios are superior to their peers.
If all this was not enough, US Tech+ has been reinvesting their free cash flow aggressively in AI related spending. As you can see from the previous charts, analysts are projecting even higher returns on capital and faster asset growth. That only leaves the question of whether this is fully priced in and what kind of risks there are with such heavy AI spending.
My point was to show that US Tech+ deserves a high multiple. Because their capital spending appears to be largely independent of MAGA policies, their torrid growth can continue for now.
While US Tech+ companies are thriving, it is the US Non-Tech+ half of the US stock market which is taking a body blow from the present regime’s tariff policies.
While market caps are 50:50, the picture is very different when it comes to employment. 79% of workers in listed companies work for the non-US Tech+ businesses (please see chart below on US workforce distribution). Although US Tech+ companies have grown their market cap share to 50% over the last 15 years from 20%, their share of US workers among listed companies has grown from 14% in 1995 to a still low 21% today. Unlisted companies are predominantly small and midsized companies, which have decidedly non-US Tech+ characteristics. Unlisted companies account for another 125 million workers, so what you see for US Non-Tech+ companies gets amplified that much more for unlisted companies when it comes to the impact on workers.
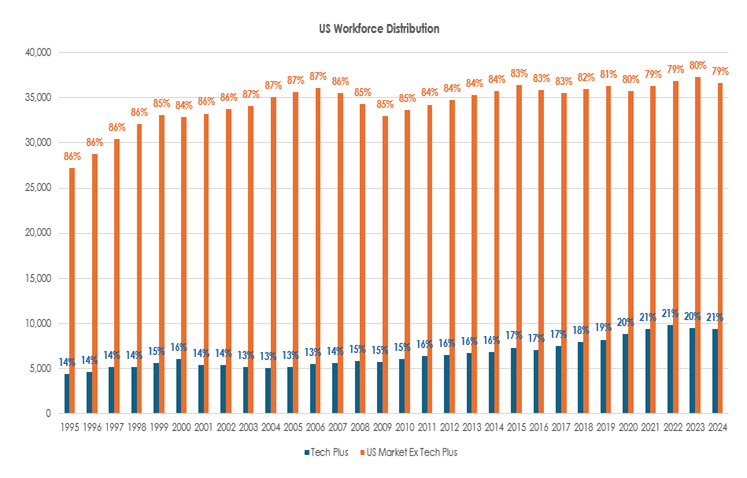
In other words, the current administration’s tariff policies are hurting 79% of workers in half the US market cap companies and exponentially more so for unlisted companies. This is why the US stock market keeps powering ahead while US economic data is signaling ever more stagflation with every fresh release.