
The Iran War and Its Impact on an Energy Crisis
Author: Rohit Sah, PhD
Published: August 12, 2026
The Energy Situation
The global energy market is moving toward a huge imbalance that, in my view, is still not reflected in financial markets. The disruption through the Strait of Hormuz has lasted longer than many expected, crude and refined-product inventories are being steadily depleted, and the loss of Russian refining capacity is compounding an already constrained system. Individually, each of these issues would be manageable. Together, they are creating conditions for an energy shock of historic proportions over the coming months.
Back in March, I expected that even after the shooting war ended, the Strait of Hormuz would remain effectively closed for an extended period. My concern was not simply the conflict itself, but what would come afterward: a shortage of available tankers, a prolonged restart of shut-in oil fields, and significant uncertainty over how much production could ultimately recover once these shut-in oil fields came back to production. That concern is now beginning to play out. While almost all of the tankers trapped in the Persian Gulf have left, few have returned, and we remain nowhere close to a meaningful restart of roughly 10 million barrels per day of shut-in production.
Oil Crisis Coming
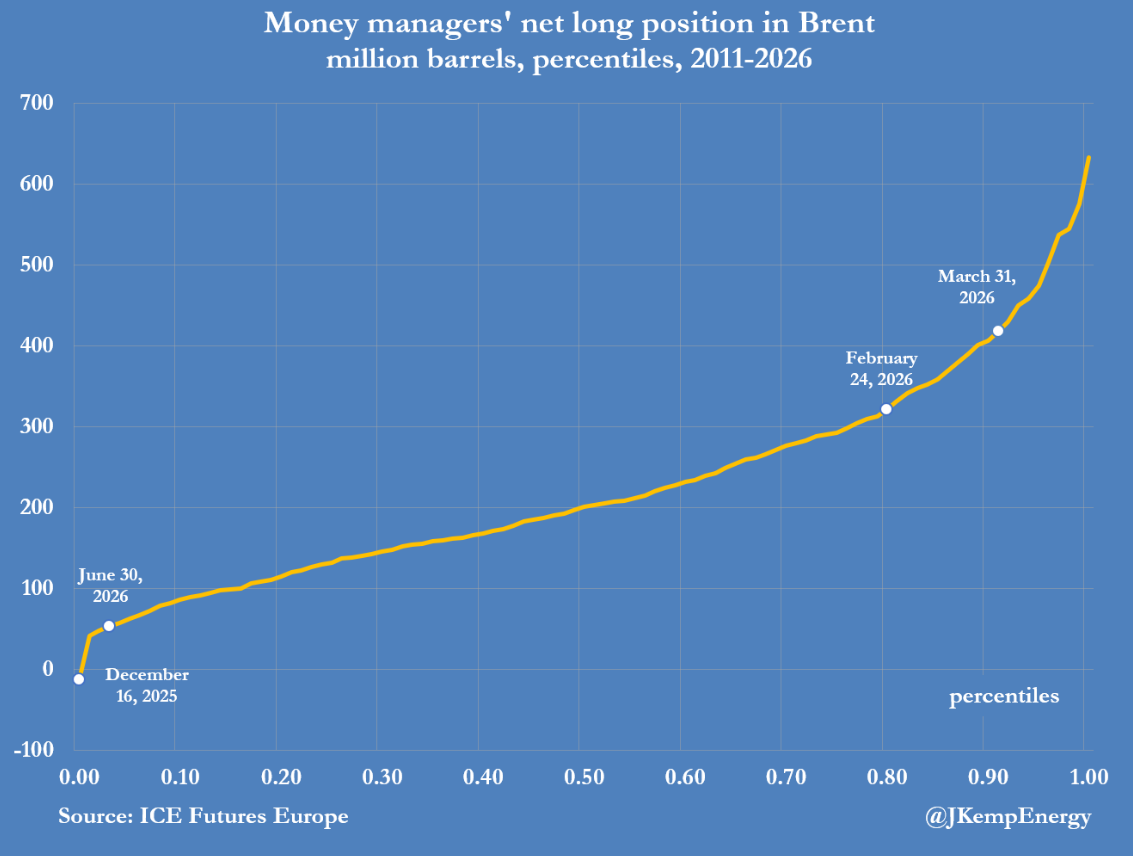
Crude oil prices at $80 a barrel are remarkably low. The world first saw $80 back in 2007, and inflation adjusted, we are 35% cheaper today than back in 2007, never mind that per capita incomes are about 67% higher today compared to 2007. Despite that, there are big shorts in crude oil futures (chart below). More surprisingly, analysts at some top investment banks are calling for lower oil prices than what we are right now! Sentiment, analysts’ forecasts, and real prices are exactly wrong given what I see coming.
Shorts on crude oil futures are higher today than 95% of the time in the last 15 years
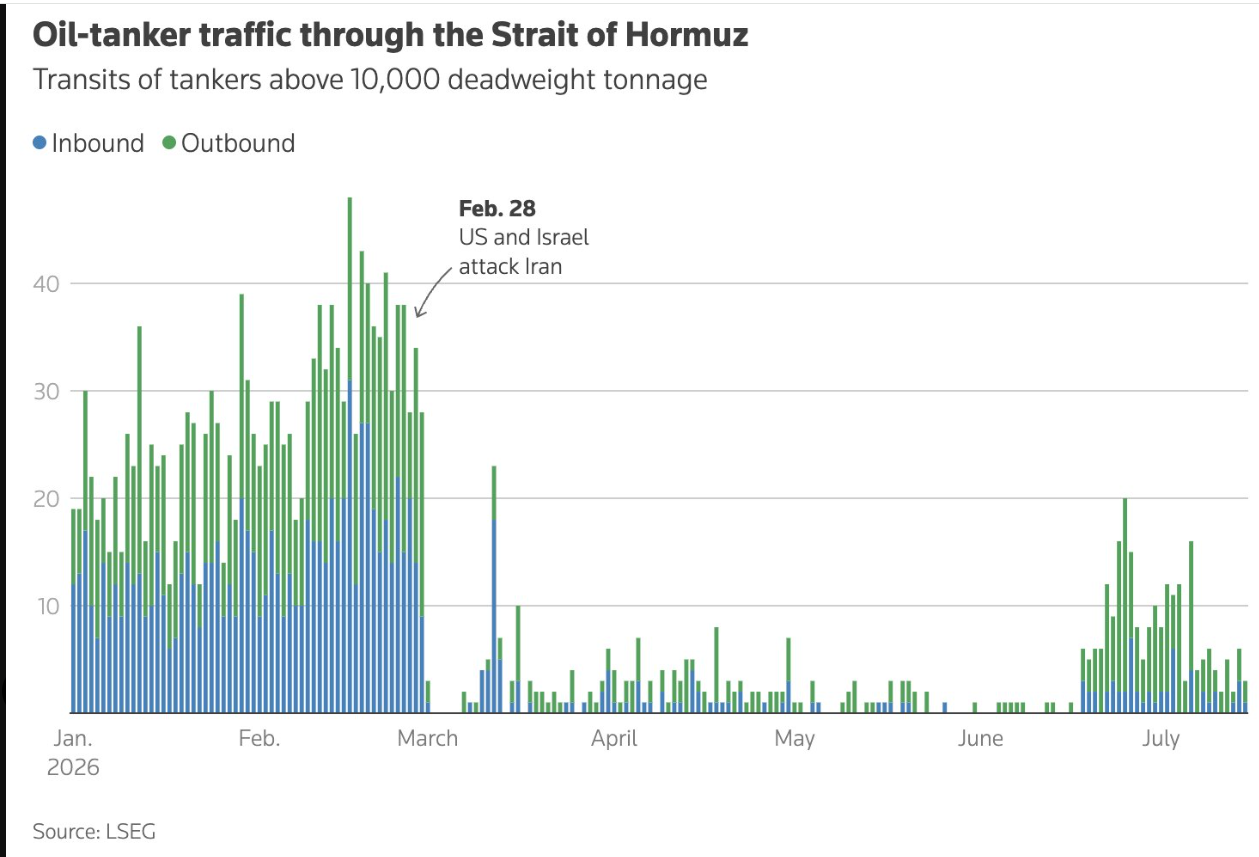
Tanker traffic today is below what was normal before the Iran War started Feb 28, 2026
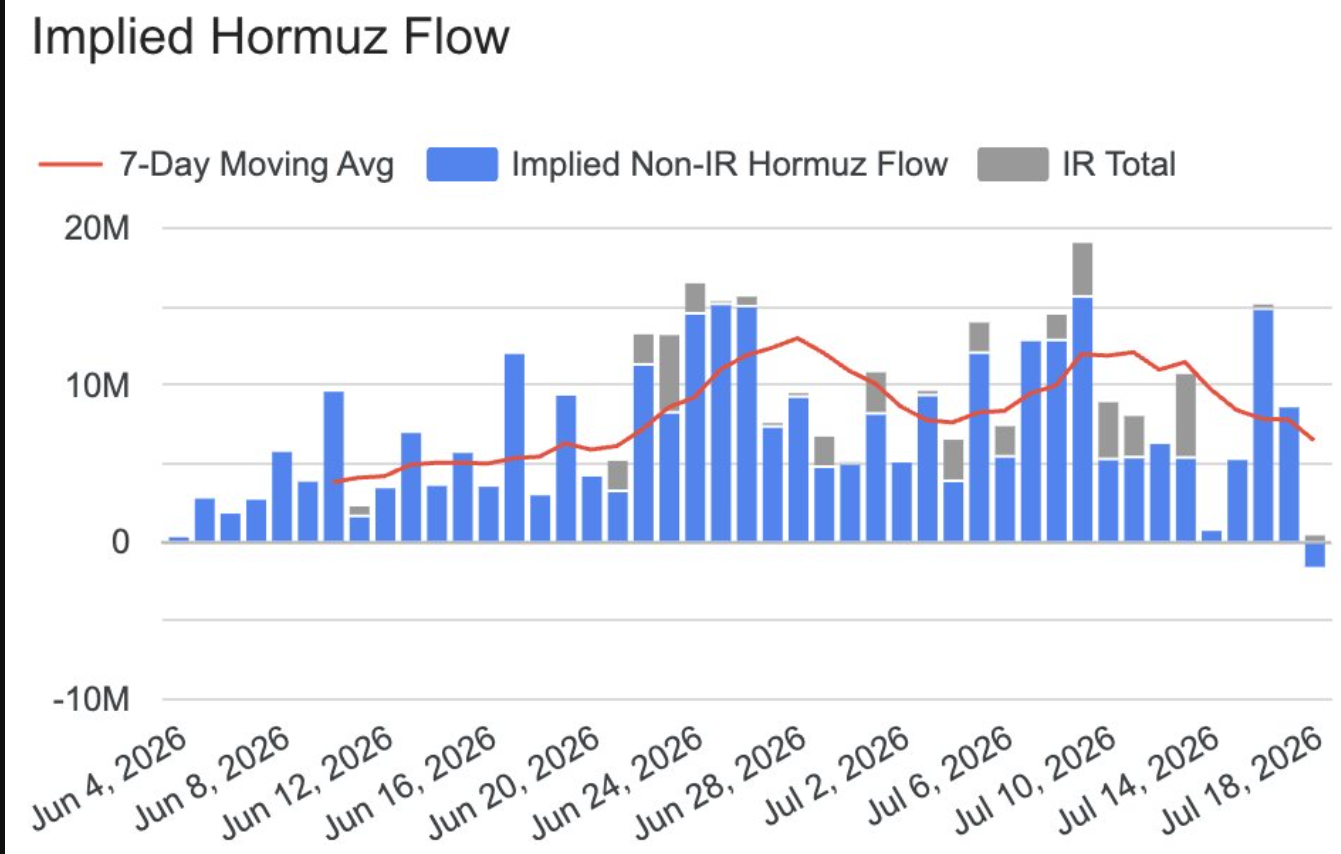
While oil tanker traffic is low, there is traffic that is not showing up in AIS signals, as ships are going dark (by switching off their AIS) while transiting through the St of Hormuz. However, some of the tanker traffic is Iran-sourced and susceptible to US sanctions, rendering them most likely unavailable. It appears that we are at about 35% of pre-war flow today (see chart below). That leaves a shortfall of over 13 million barrels/day through the St of Hormuz. Some of this is being offset by Saudi Arabia sending oil out of their Red Sea port of Yanbu. Some of it is coming from the UAE quietly sending oil out through the St of Hormuz, as well as increased pipeline throughput through the port of Fujairah. In their earnings call, Saudi Aramco talked about the world losing 11 million barrels/day of “liquid supply”. Whatever the actual figure is, we are way below what is needed by the global economy.
Oil flows today are running at only 35% to 60% of prewar levels
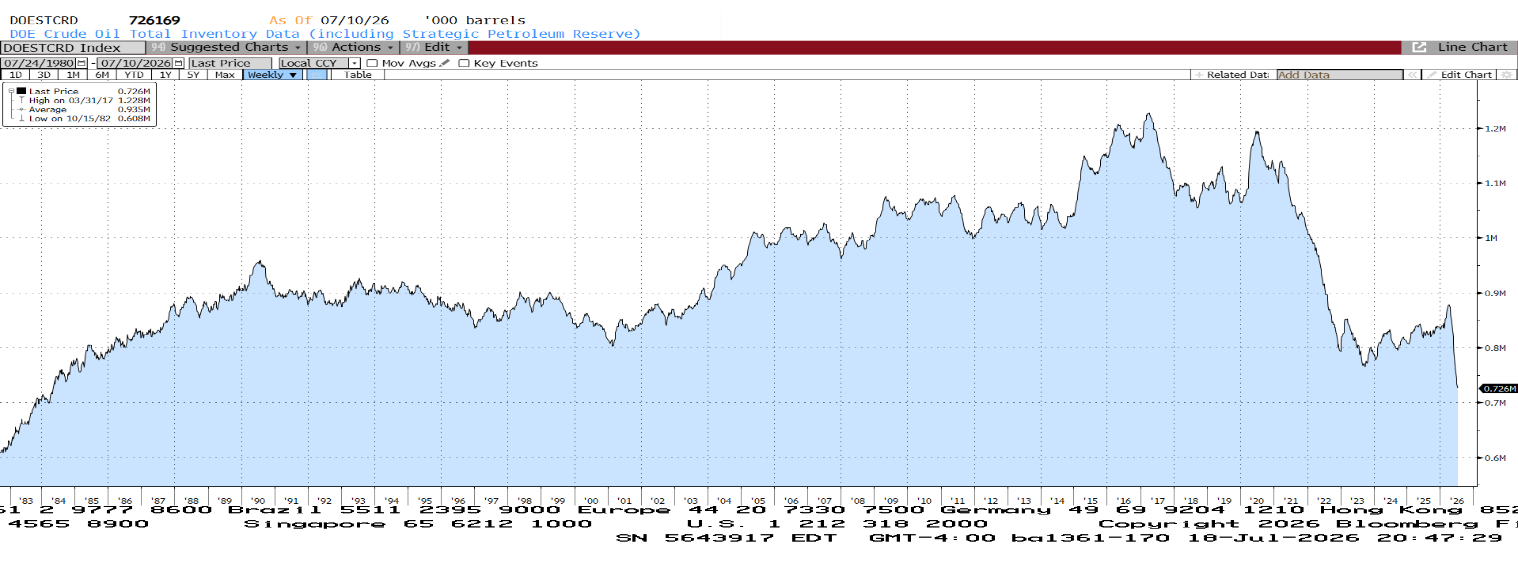
Meanwhile, oil inventories of crude oil and oil products continue to drain away. Given issues with data quality and timeliness, I use data for US crude oil inventory, and it is fair to assume that the rest of the world is in similar shape. We are at levels last seen in 1983 (see chart below). Even this is an overestimate; Amos Hochstein, former White House Senior Energy Adviser, says that the US Strategic Petroleum Reserves can’t be drained below 300 million barrels (the salt cavern storage infrastructure falls apart); they are at 316 million barrels today. To operate US commercial crude oil, we need a minimum of 350 million barrels (for pipelines and basic refinery functioning etc.); we are at 412 million barrels today. In short, we are near the end of our ability to tap the Strategic Petroleum Reserves, and our commercial reserves are at very low levels.
Total US Crude Oil Inventories (including the Strategic Petroleum Reserves) are at levels last seen in 1983
The Crisis in Oil Products
Meanwhile, we have a looming crisis in oil products worldwide. Although we started 2026 with record high inventories in oil products, that buffer has drained away. The next three months have the highest oil consumption rates in the Northern Hemisphere, so we will reduce our oil product inventories much further. While the media talks about “demand destruction” (another way of saying higher oil prices cause lower consumption), we have not seen high enough prices. The drain will continue until prices move up considerably.
US Oil Product Inventories are at low levels
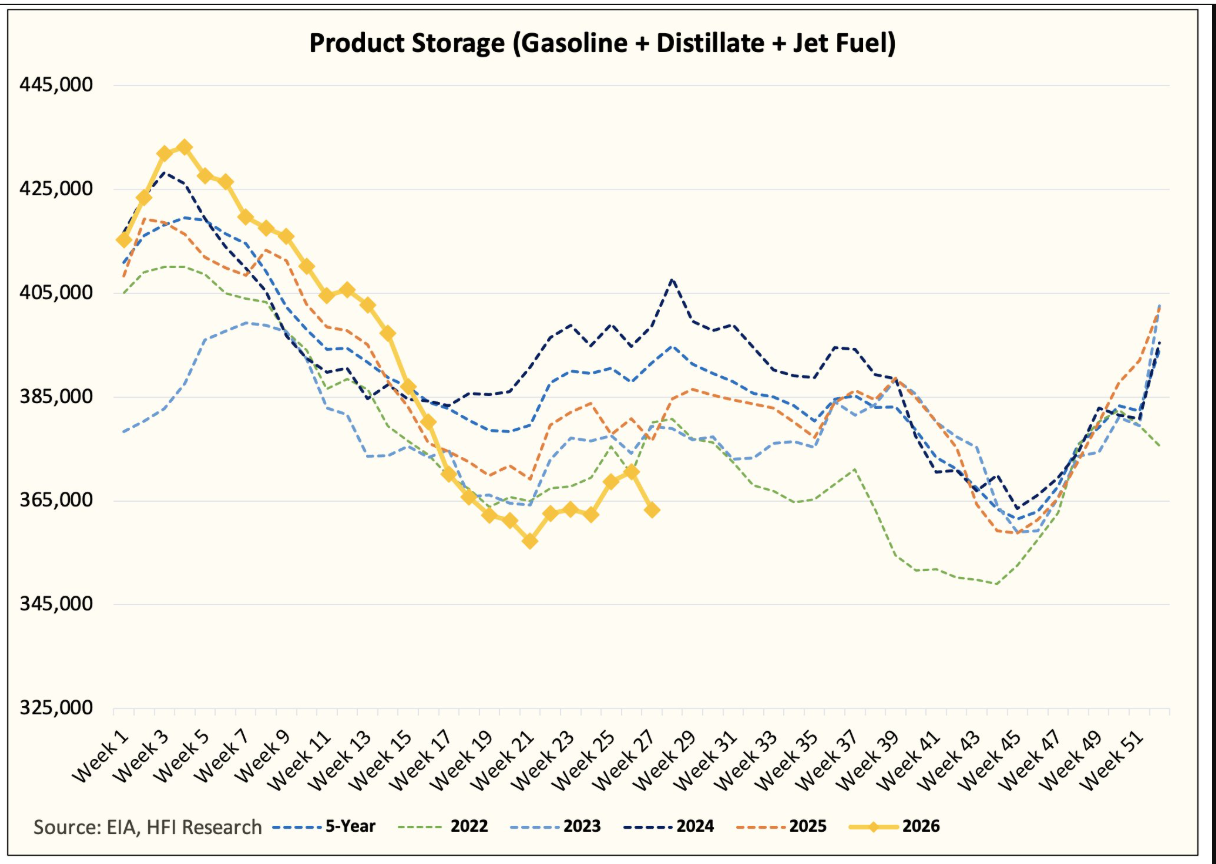
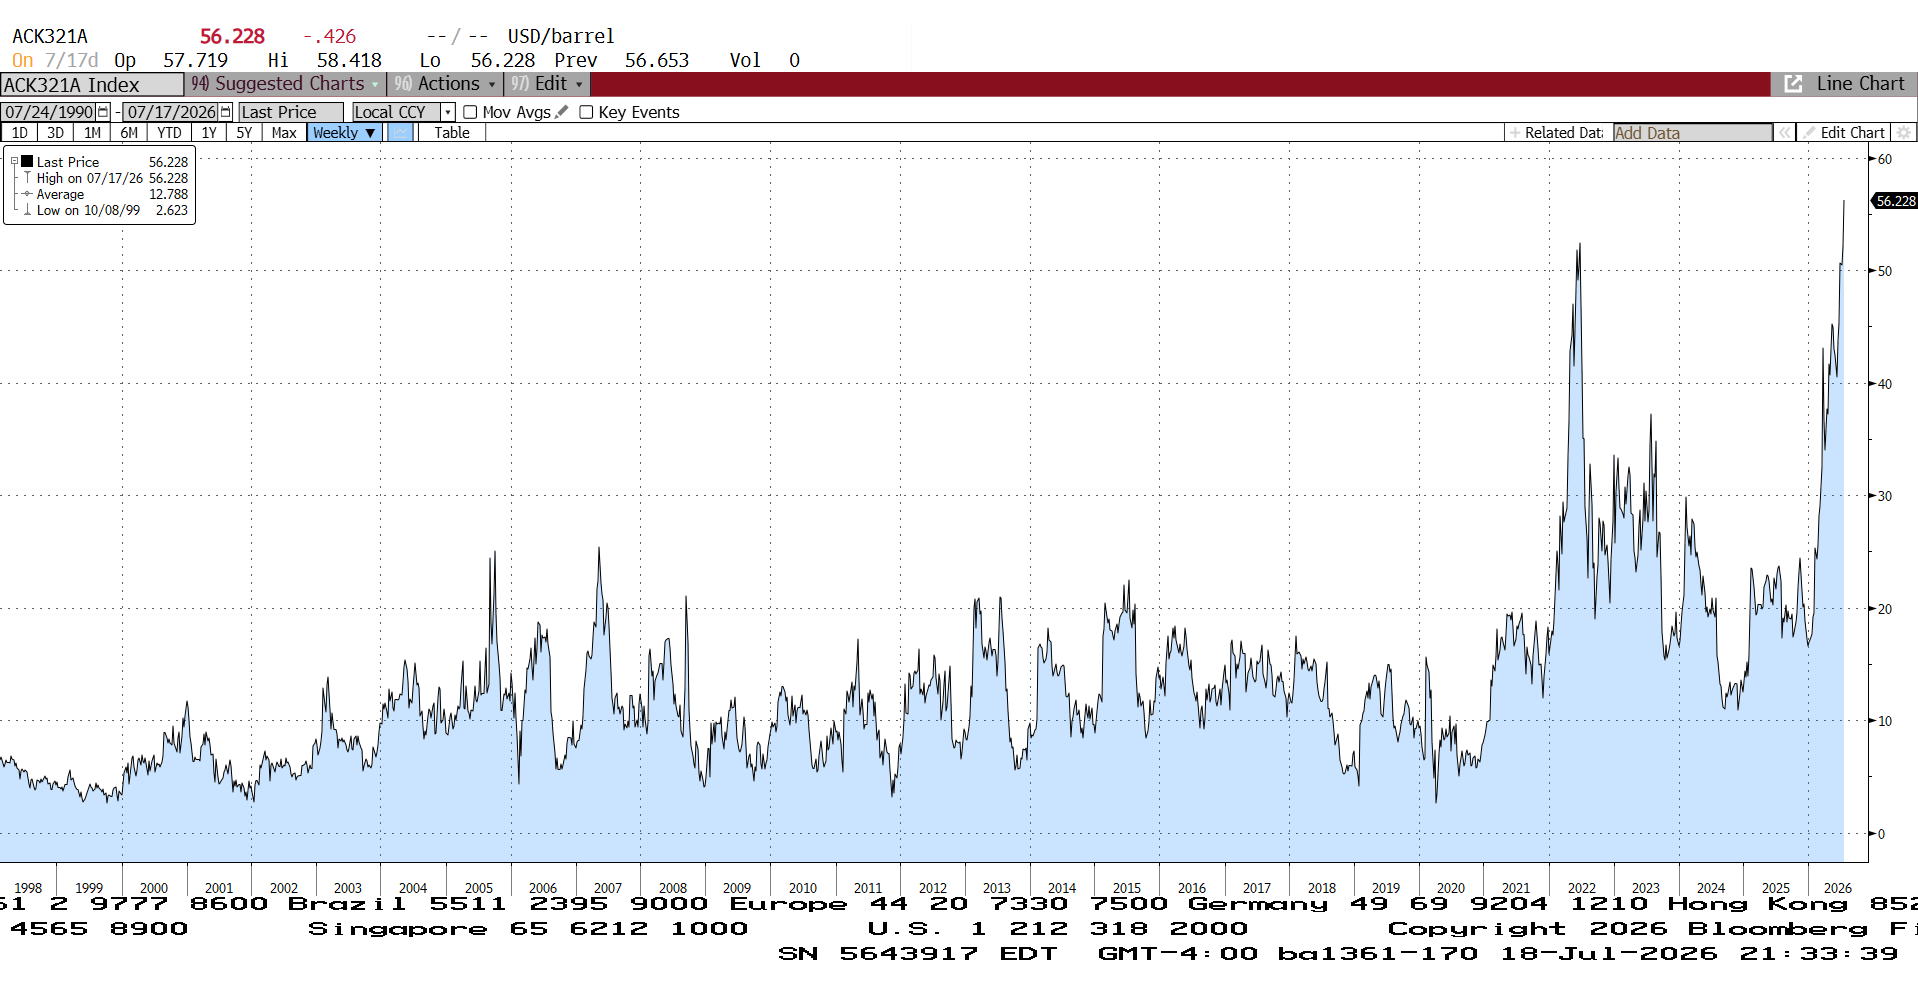
Because prices are still too low and despite US oil refineries running flat out, using all the crude oil they need, oil product inventories keep falling. This shortfall in inventories is causing refining margins (also known as crack spreads) to soar to levels never seen before (see chart below). This may seem like a short-term problem. After all, if oil refiners continue to run at maximum capacity, then surely gasoline/diesel/jet fuel inventories should eventually start rising. Unfortunately, that is not what happens in practice. Every day of inventory drain will require 5 days of full oil refinery throughput as only excess refinery output can offset continued consumption. If we use rising crack spreads as a proxy for when this crisis began, we are at over day 120, so oil refiners will have to continue to run at full tilt for the next 2 years to replenish our oil product inventories. What would have been a manageable short-term oil product drain has morphed into a long-term oil product inventory crisis.
3 2 1 Crack Spreads are at record highs
The Importance of Russia
The media has been focused on Iran for obvious reasons; it involves the US and is more visible. However, just as important is the Ukraine War. In recent months, Ukraine has gone after Russia’s oil refineries, oil tankers and oil export infrastructure. Data is not reliable for Russia, but we know that Russia exported 4 million barrels of crude oil a day; 4% of global crude oil sales. It also exported just under 1 million barrels of diesel every day before the Iran War started (about 4% of global diesel consumption). Ukrainian hits on Russian oil refiners have been very damaging. It is not that any one strike knocks a refiner out of operation. It is like boxing someone repeatedly that it eventually renders them lifeless. Repairs to such refineries can take months if not years. As a result, Russia’s diesel exports have effectively stopped, and in fact Russia is starting to import diesel from India. This is truly ironic: Russia, one of the world’s 3 biggest oil producers, has been reduced to buying from one of the world’s most energy starved countries. Unfortunately, the way out for the world is for Russia to get back to its old trajectory in oil production and refining. There is no prospect of this happening anytime soon.
The biggest refinery capacities in the world by country are China and US (combined about a third of global capacity), with Russia and India at 5% each. The other key regions are Korea/Japan, and the Middle East, with the rest scattered around the world. The problem is that China, India, Japan, Korea and Asia in general, depend on crude oil from the Persian Gulf to feed their refineries. As a result, the world is now short refining abilities. With the end of Russia as an oil product exporter, and the closure of the Strait of Hormuz, it is not clear where the world can get its oil products, particularly diesel. One major untapped source is China as it is estimated to have well over 1 billion barrels of crude oil in its sovereign inventory. However, China itself has lost over 300 million barrels of crude oil inventory, and it is not clear what Xi Jinping will allow. With Russia, the Middle East (closure of St of Hormuz), and Asia (short on crude oil from the Persian Gulf) out of action, the US has become the sole major exporter of diesel. As diesel gets exported out of US inventories, crack spreads continue to ratchet higher. Therefore, diesel prices have nowhere to go but up. Now it is true that refiners can rejig their production to increase diesel output, but it is at the expense of other oil products like gasoline or jet fuel. It is a whack a mole oil product crisis, and diesel is at the fore front of it right now.
The chart below shows diesel prices in the US in this century. They were $3.50 per gallon at the end of 2025 and are $4.80 now. Diesel is intrinsically linked to inflation. Everything you touch has at some point been put on a forklift and a truck which in turn are powered by diesel. Therefore, diesel prices feed directly and indirectly into higher inflation.
US Diesel Price over the 21st century
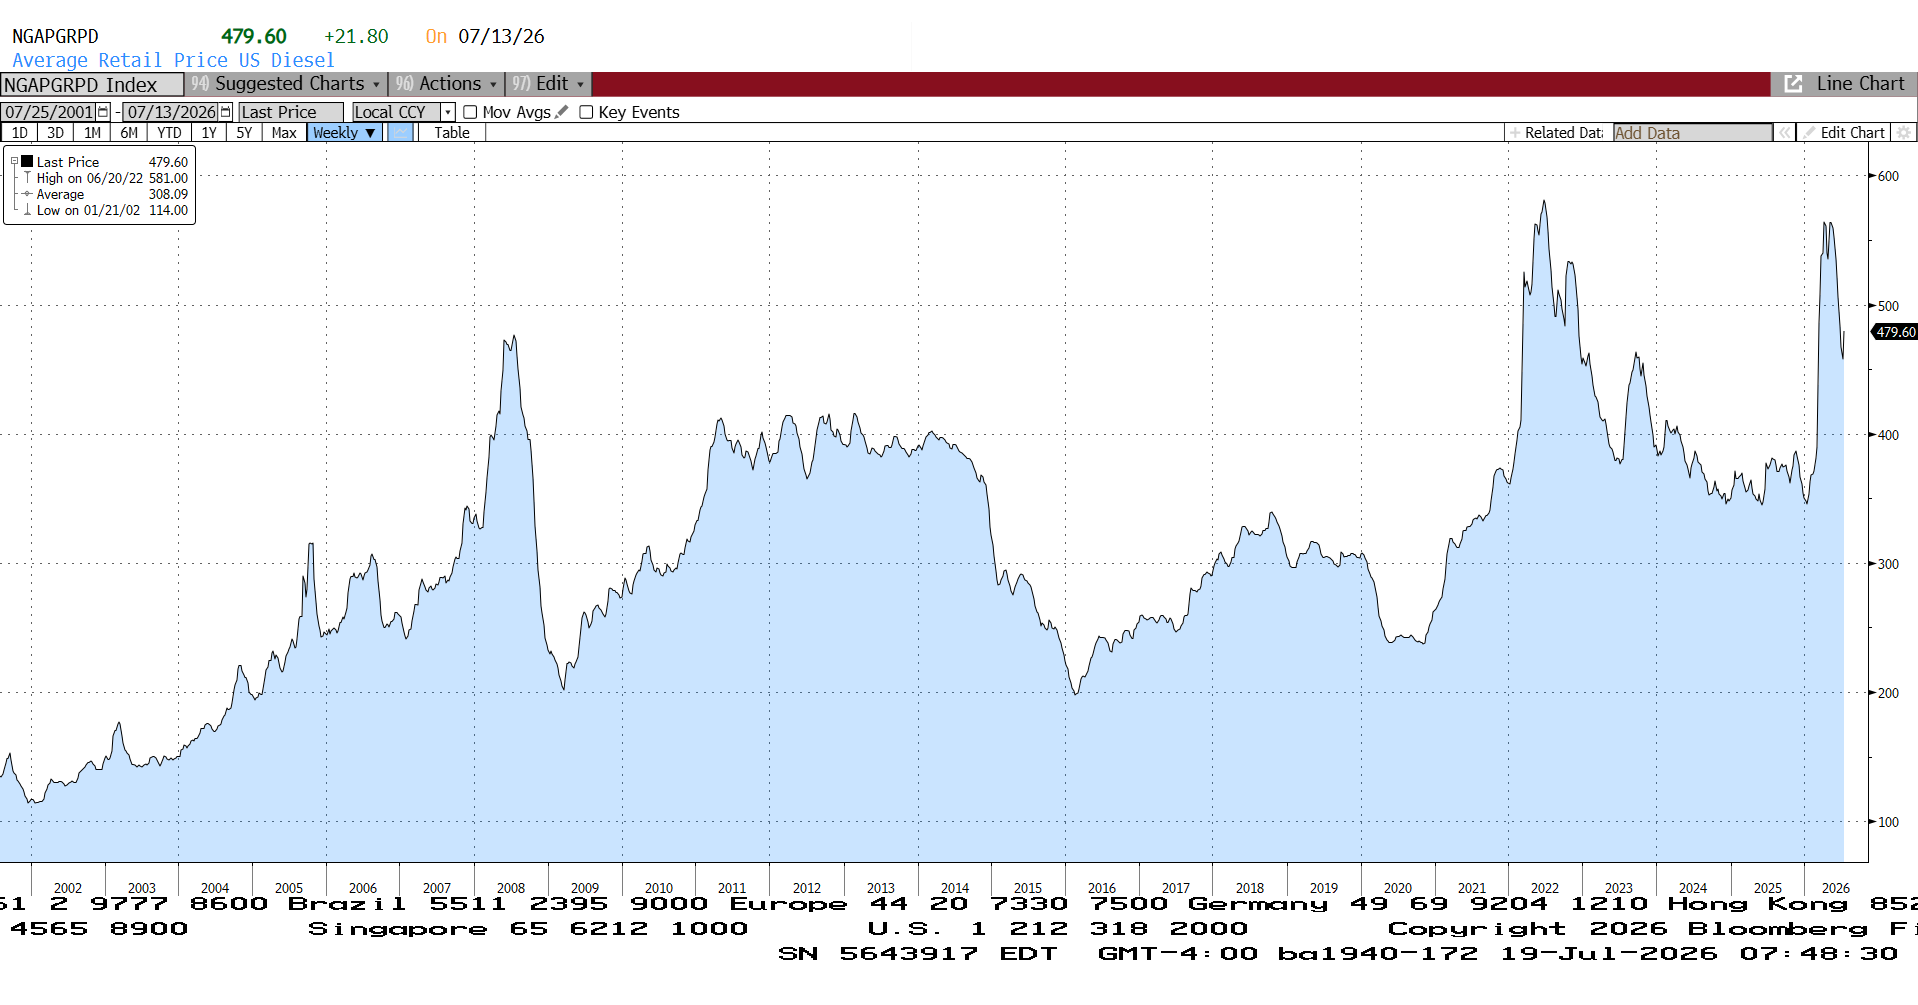
Higher inflation will be bad news for financial markets. The US is already running massive fiscal deficits at 6% of GDP, causing some stress in US Government bond markets. With the Fed’s credibility already low, the risk is therefore of much higher 10-year US Govt bond interest rates. Higher interest rates would be detrimental to US equity valuations, notwithstanding exceptionally high earnings growth expected this year in the US.
The next several months may very well turn out to be the most consequential for financial markets, for years to come. If the Iran War does not come to a conclusive end (as measured by shipping traffic through the St of Hormuz normalizing), then energy prices will soar to levels no one dare talk about right now. Even without a soaring oil price, oil equity valuations are simply too low.