The Crude Oil Tanker Industry
Why it is in a long-term bull market, what bear market seasoned shipping analysts are getting wrong, why it is a leading indicator for the oil industry and how it is a template for commodity markets in general
Author: Rohit Sah, PhD
Published: December 16, 2025
Summary
The tanker market is in a structural supply deficit, a deficit that cannot be fixed for several years. A large fraction of the current already old fleet is set to be scrapped within the next few years. Old ships leave the market faster than newly built ones can be launched, creating unprecedented upward pressure on tanker charter rates.
The world’s shipyards are fully booked to build container ships and the like with the earliest available new build starting in 2028, which means that even if VLCC owners were to order new ships, they cannot be launched for years. Recently, old ships have been bought by Russia to transport their oil to Asia, creating a parallel market (shadow fleet) to the tankers which are compliant to Western rules. This means there is a super bull case: if the shadow fleet was rendered unavailable for whatever reason (war insurance becoming too expensive would be one), then tanker charter rates will go sky high.
Because the tanker industry has been in a bear market for many years, shipping equity analysts have understandably assumed the fetal position in putting out recommendations. Like many commodity analysts, such shipping analysts have defaulted to Net Asset Value, the idea being that a company is only worth the value of its assets if the ships were marked to market. However, such an analysis is not forward looking. In our view, given the new realities of the VLCC market, secondhand ship prices are lagging well behind cashflow multiples that such ships can command today. We estimate asset values more in line with what we expect future cash flows to be, apply them to Frontline plc and find that Frontline’s share price is woefully undervalued.
The tanker market serves as a leading indicator for the crude oil market. The key determinant for the price of crude oil is refinery margins. High refinery margins mean oil refineries are making profits well above their cost of capital. This translates to higher demand for tankers to ship oil around the world. But if refinery margins fall too much and cause crude oil storage to fill up, the crude oil market may flip to a contango. This is where future prices are higher than current prices, incentivizing the storage of oil, some of which will show up in tanker demand. In other words, tankers serve as canary in the coal mine for crude oil markets. Eventually, such a contango will set up excellent conditions for investing in crude oil producers, as their equities fall sharply with crude oil prices, like they did in 2020. This will create conditions for the next bull market in crude oil.
The tale of the tanker industry can be told for many commodity markets. We see the same pattern repeating itself in other commodity markets, for example in uranium and copper.
The Crude Oil Tanker Industry: A Primer
Of global crude oil production of over 100 million barrels a day, roughly 20 to 30 million barrels is loaded onto crude oil tankers every day. Much of it is transported through VLCC (very large crude carriers) sized tankers and most of them are less than 20 years old. VLCCs are the optimal size ship, although larger and smaller sized tankers do exist. Their size makes it cheap to ship oil, and most ports accept VLCCs while even larger ULCCs cannot dock at many ports. This is important for tanker customers like Exxon, which want to retain optionality when booking a VLCC: the cargo can be re-directed to a different port, even if the ship is in transit to a particular port.
Tanker Sizes and Classes
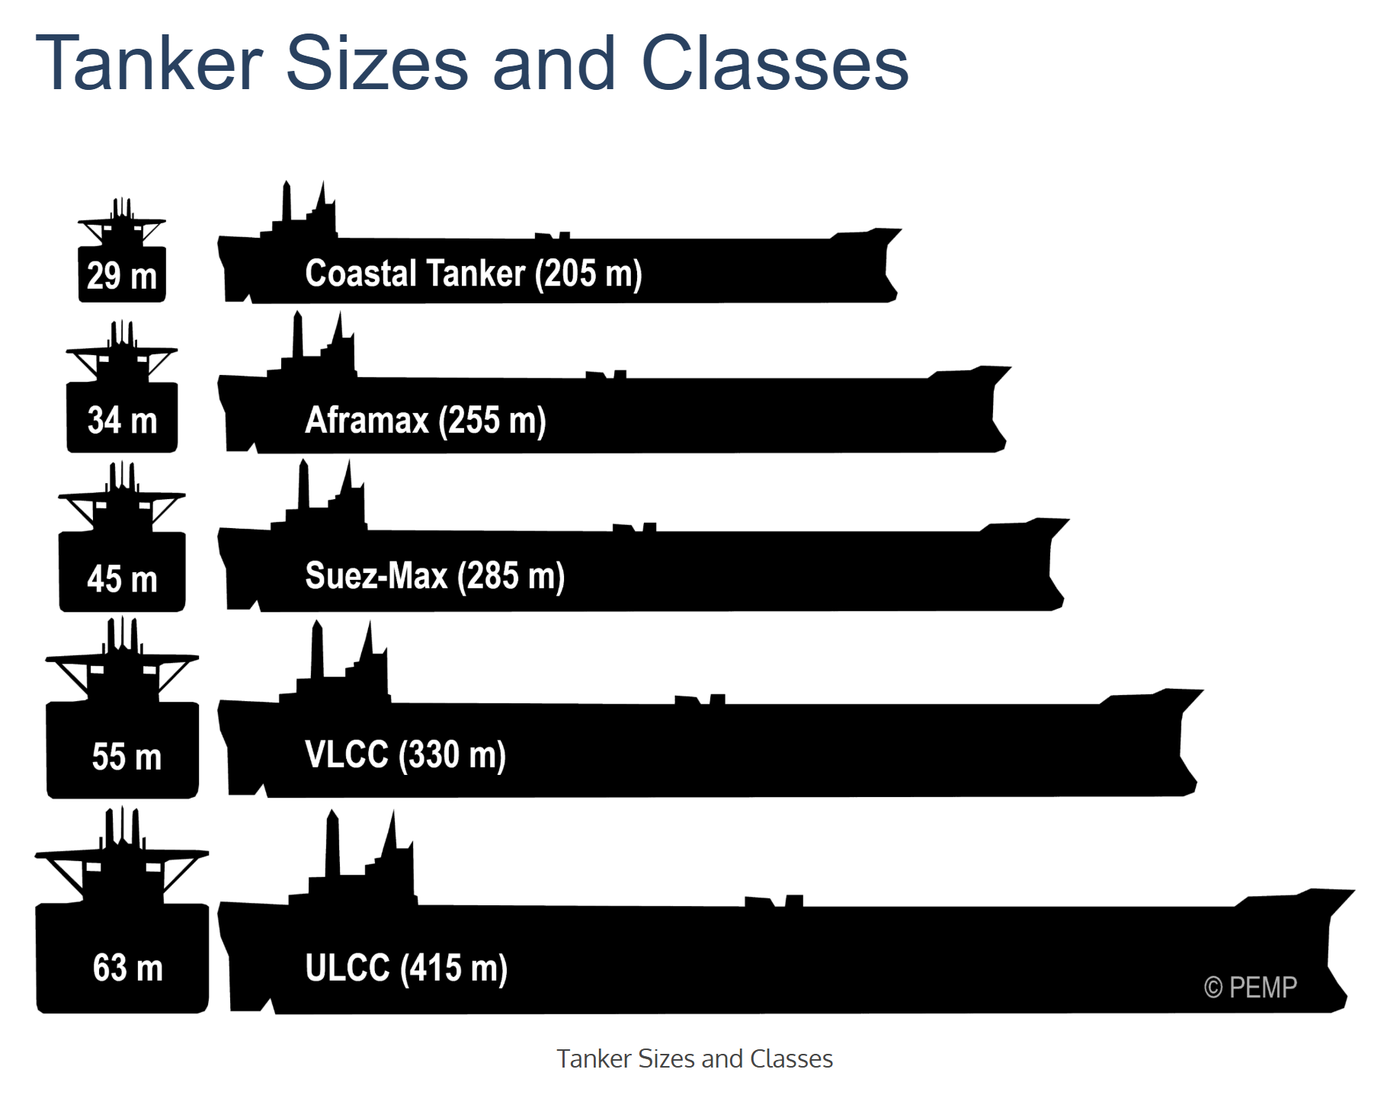
The useful life of a VLCC is 20 years as many ports do not allow older ships to offload, and such ships are mostly scrapped, although many such very old ships are often used as floating oil storage. But even a 15-year-old tanker requires intensive inspections for which it is kept in port for weeks, significantly reducing its productivity: sea transport is quite damaging to the hull of the ship. Therefore, the best run shipping companies tend to sell their ships once they reach 15 years of age.
The Tanker Industry over the last 25 years
Tankers are built mostly in China, Korea and Japan, but their supply is constrained by shipyard capacity. In other words, you can order a VLCC, but when you get delivery depends very much on how busy such shipyards are. These days, there is a 3-year lag between signing up for a new VLCC and actual delivery of the VLCC as these giant shipyards are busy building container ships, cruise ships and the like. Although there are other types of tankers (as you can see in the illustration above), we will confine ourselves to a discussion of VLCCs as these are the work horses of marine transport of crude oil.
In the early part of this century, there was no such shipyard constraint as China opened up several new shipyards. With China becoming an ever-bigger importer of crude oil, tanker demand exploded higher causing tanker charter rates to soar. This led to a surge in new VLCC orders, a surge that was met by frenzied VLCC-building at several shipyards. As a result, VLCC daily charter rates fell back, and the world was left with a large and relatively young VLCC fleet into the 2010s. This increased supply was in fact needed by the world economy, as new sources of demand from China and India had to be met by not only the Middle East, but also new sources of supply from the USA, Canada, Brazil and Guyana. In other words, ton miles for the crude oil tanker industry are on the way up, if ever so incrementally every year, as the Middle East remains the source for over 70% of sea borne crude oil supply.
VLCC deliveries, orderbook and scrapping
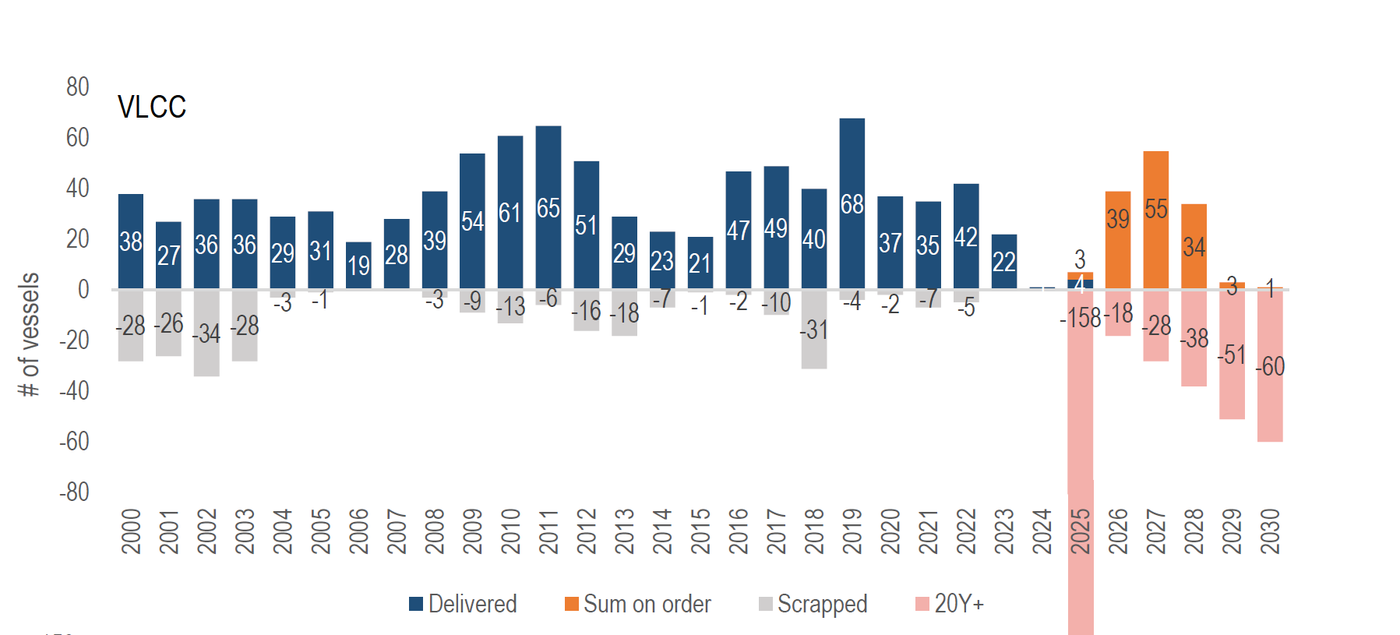
The above chart shows the VLCC industry’s supply of new ships along with ships sent to South Asia for scrap. The chart below shows that 29% of VLCCs and 45% of Aframax tankers are over 15 years of age and are rapidly approaching the scrap yard.
VLCC and Aframax fleets by age
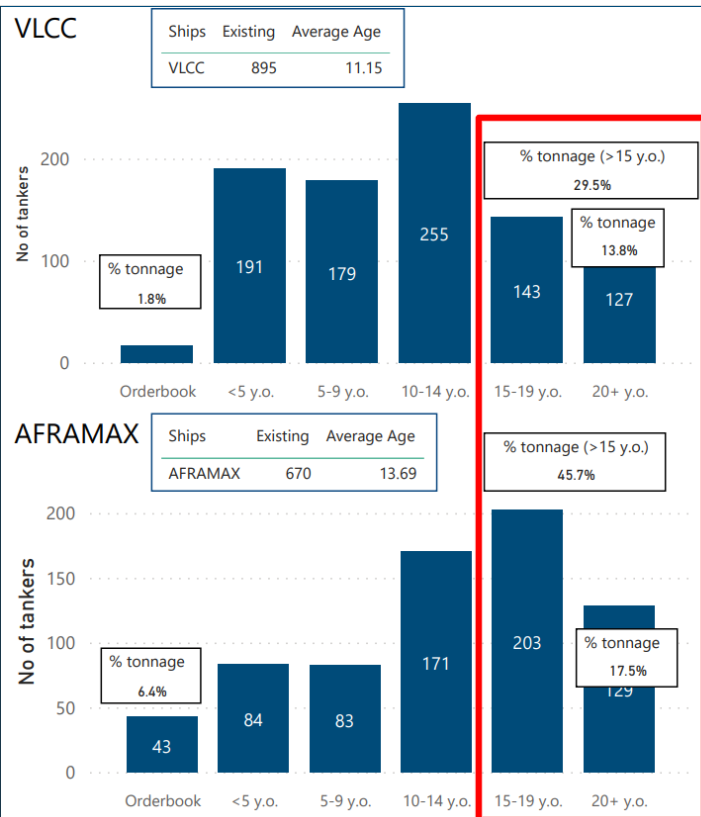
The supply crisis for the crude oil tanker industry is right here. What about new ships?
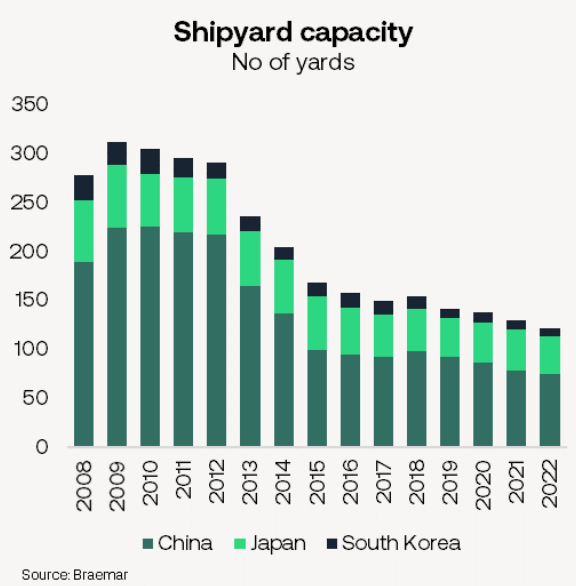
Shipyards have been consolidating for years. As you can see below, the number of shipyards itself has been shrinking worldwide. Meanwhile, incoming orders for new container ships are set only to be delivered in 2030.
Shipyard capacity (number of yards)
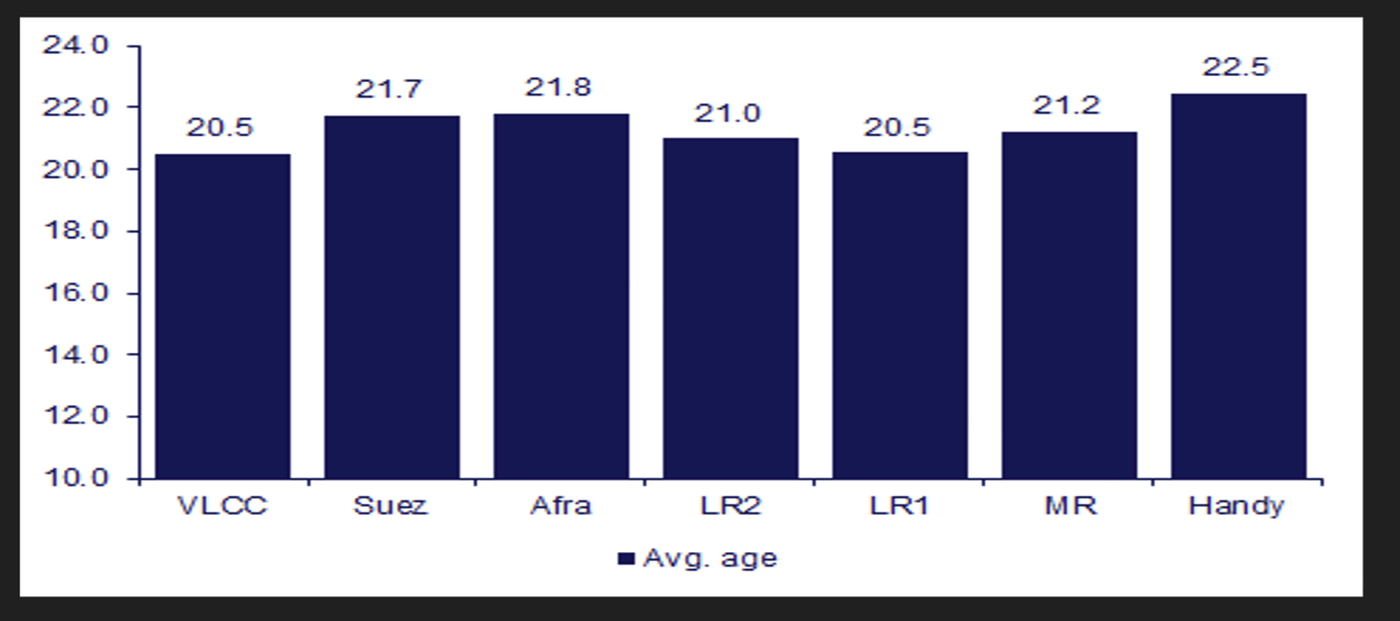
After the Ukraine war started and Russia was heavily sanctioned by the West, Russia started buying up old tankers. Noting the average age of the tankers in the chart below, these are ships that should have been scrapped. If they become unviable for whatever reason, the disappearance of this fleet will create a massive boom for the tankers that are compliant with Western rules. Two events have brought this scenario into focus. The seizure of a loaded shadow tanker off the coast of Venezuela sent shockwaves through the marine industry as the potential for other shadow tankers to be seized is now very real. The other disruptive event is the attack on Russian shadow tankers by Ukrainian sea drones. Both events have caused war insurance premiums to soar on such ships. Once this war is over, the expectation is that we will revert to oil flows of the past, where Russia sells its oil to Europe. However, it is hard to see how ports in Western Europe will allow 20-year-old tankers with dubious insurance policies to unload in their harbor. If anything, Russian flows to Europe using compliant tankers may push tanker rates even higher. Only time will tell if such events cause this trade to come to a grinding halt.
Average Age of the world’s Shadow Tanker Fleet
Overly bearish shipping equity analysts
As noted earlier, the tanker industry has been in a bear market for several years, hemmed in by too many ships for too many years. The industry had not been able to meet its cost of capital. As a result, investors are not willing to give them the benefit of any doubt. Shipping equity analysts accept the bearish bent of their investor clients and have defaulted to valuing tanker equities only on the basis of their net asset value. This methodology works in a market that is going sideways. But they fail in an overly bullish market.
Secondhand ship prices reflect the discounted value of future cash flows. In a static market, such prices are a fair reflection of true discovery. However, when there is a bull market, such prices fall well behind true value. As charter rates go up, ship owners become reluctant to sell what are becoming high yielding assets. The secondhand market will become thinly traded and a poor reflection of true value.
Let’s run through a scenario for Frontline’s assets. Frontline’s shipping assets are currently valued at $5 billion, with an average age of 7 years. A 7-year-old VLCC trades at about $105 million. This corresponds to about a $55,000 daily rate. Of course, a heroic assumption here is that the $55,000/day rate will be maintained for the next 13 years, contrary to the realized rates before 2019 which clocked in at an average of $30,300 for VLCCs.
A discounted cash flow analysis at 4.2% for a $70,000 charter rate per day over 13 years translates to a present value of $166 million (assuming a breakeven of $25,000/day and scrap value of $20 million at 20 years age). That is a 58% premium to the current price. We assume all the cash flow will go to dividends and debt payments.
Repeating the exercise:
| Daily charter rate | Present value per VLCC |
|---|---|
| $70,000 | $166 million |
| $75,000 | $183 million |
| $80,000 | $199 million |
Given the upside to charter rates, a $70,000 daily rate would mean that Frontline’s 80 ships should be valued at $5 billion x 166/105 = $7.9 billion. The market cap should be valued at $5.1 + $2.9 = $8 billion, a 57% increase. Repeating at $80,000 yields a 96% upside.
While these estimates are meant for illustrative purposes, the point remains: current second hand VLCC prices are underpriced by anywhere from 57% to 96%. This scenario is not captured in any shipping equity reports. At most, such analysts say that tanker charter rates can stay elevated but are unwilling to state that this would imply a much higher stock price for Frontline plc. Note that total returns from holding Frontline shares would be even higher as we have assumed no free cash in our valuations, just asset price changes. But in 2026, we expect a $6 per share dividend, which would mean another 26% upside to total returns. Tanker equities are drastically undervalued.
The Tanker Industry as the canary in the crude oil mine
In 2020, the world shut itself down to fight Covid 19 and the result was a collapse in crude oil demand. Oil futures went into a contango, where future oil prices trade at a premium to spot prices. But oil companies shut down oil wells as a last resort and would rather store crude oil as a temporary solution. With nowhere to store oil after land-based tankers fill up, oil companies turned to VLCCs and the like to store their surplus oil. Tanker rates had collapsed in the immediate aftermath of the start of Covid then soared all the way to $240,000 a day, an unheard-of rate, before falling back after a few weeks. This inverse relationship can be seen in the chart below. The higher spikes in tanker rates are matched by an equally unheard-of plunge lower in crude oil prices in April 2020:
VLCC charter rates (USD/day) vs. Brent crude oil price, 2019-2025
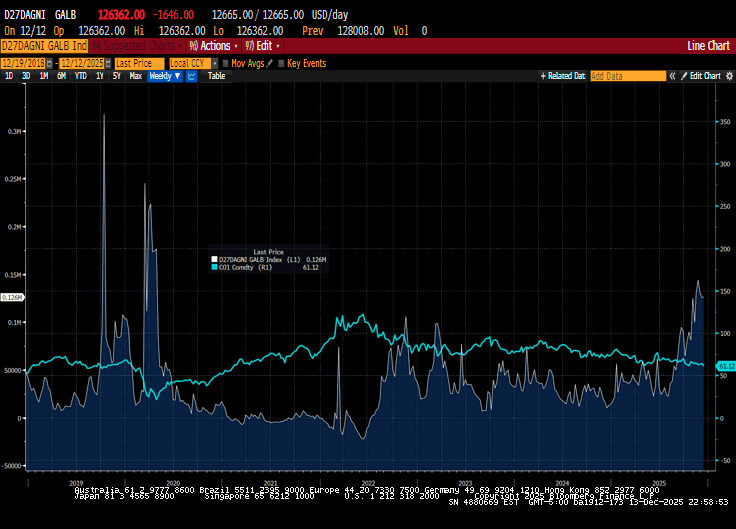
The point here is that just as crude oil prices fall to a near term low, tanker rates do exactly the opposite and go sky high. In other words, the right time to start buying oil producers is when tanker rates peak. This is what happened in 2020 and is most likely to happen in 2026.
The Tanker Industry as a Template for other commodities: the case of Copper and Uranium
In the tanker discussion we saw a boom in supply of tankers at the beginning of this century. Thereafter, low charter rates caused a reduced supply of new tankers, culminating in the situation we find ourselves in today: a structural deficit of tankers that cannot be fixed easily.
A similar story can be told about several commodities. In this write up, we will consider copper and uranium, but there are several other commodities where a similar tale can be told.
This suggests that we are on the cusp of a structural supply deficit in several commodities, a crunch that will not be easily resolved any time soon.
Copper
Today’s copper mines are getting older and lower grade
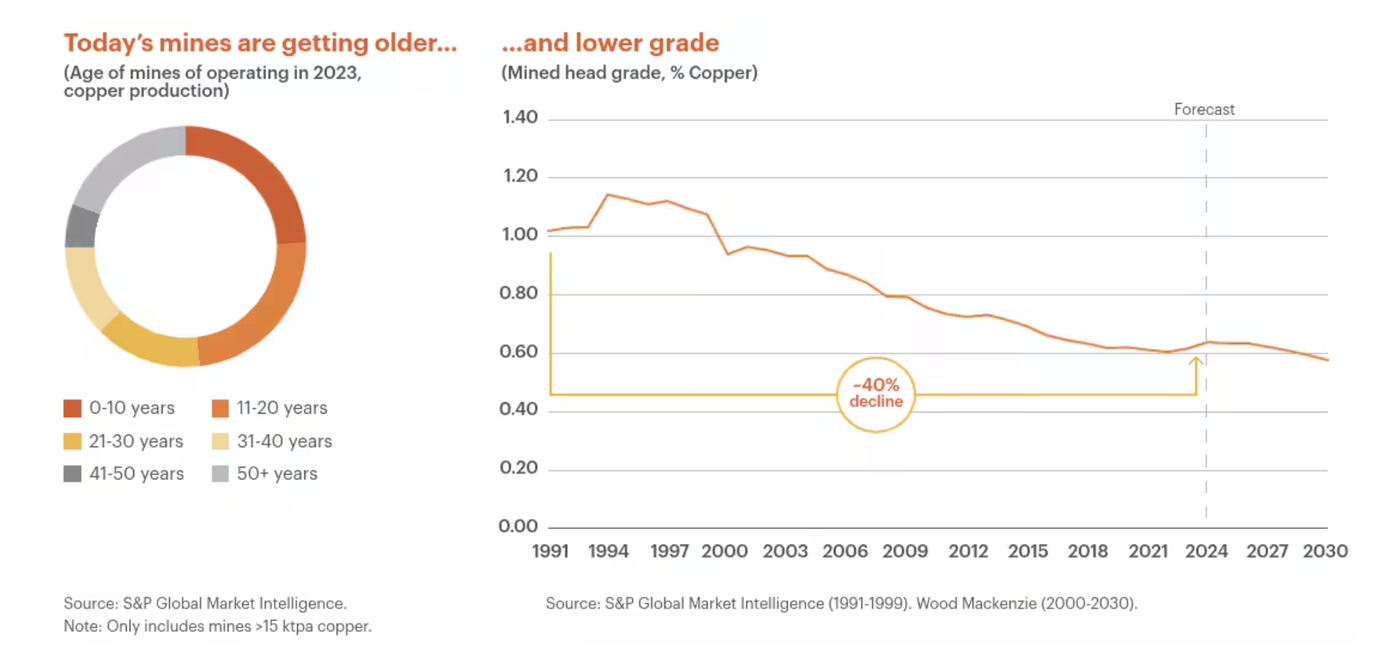
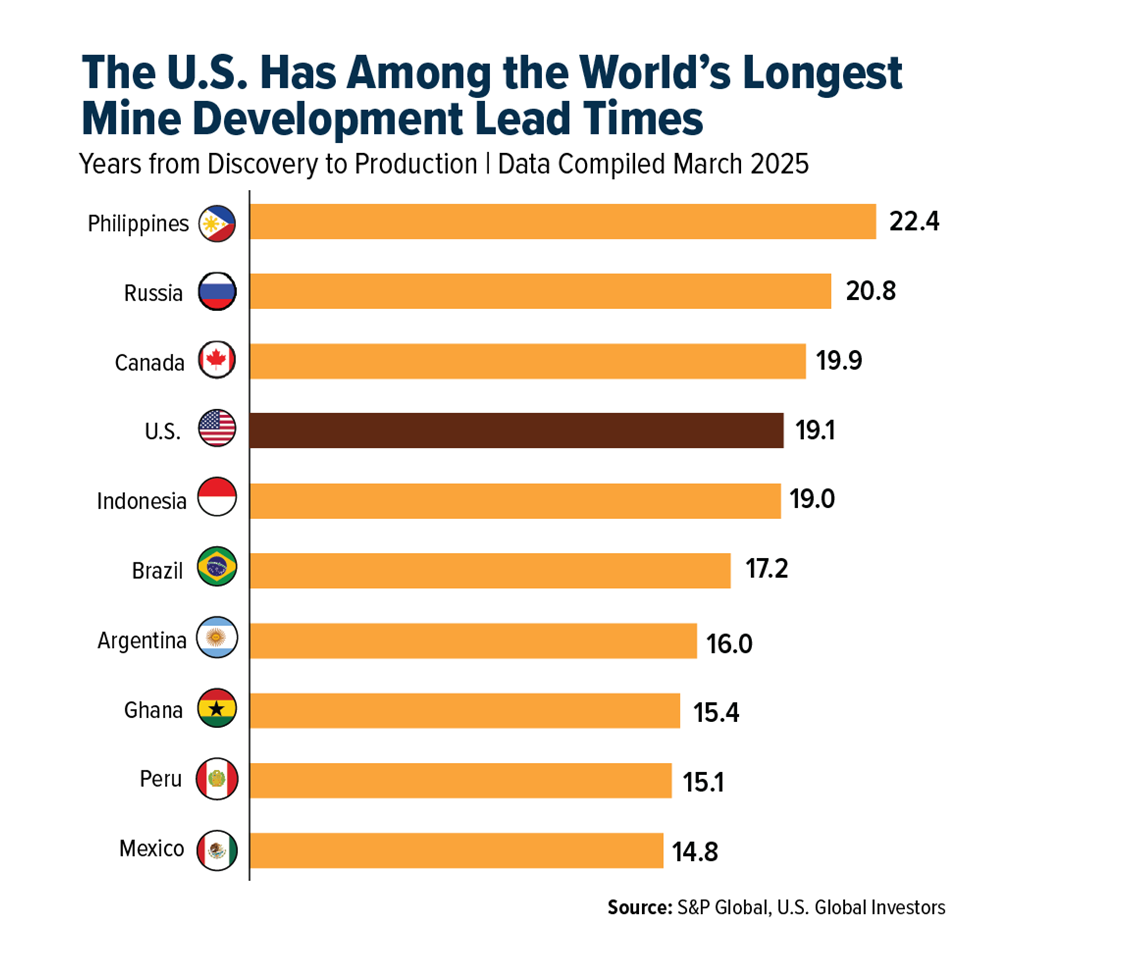
BHP estimates that a third to half of the world’s copper supply faces grade decline and aging challenges over the next decade, as you can see from the charts above. This kind of fall off is not easily fixed and will require vast amounts of resources to simply maintain supply. On top of that, finding deposits and bringing them to production takes several years, particularly from permitting issues in the West as you can see from the chart below. This is similar to the problems of the tanker industry.
Years from discovery to production
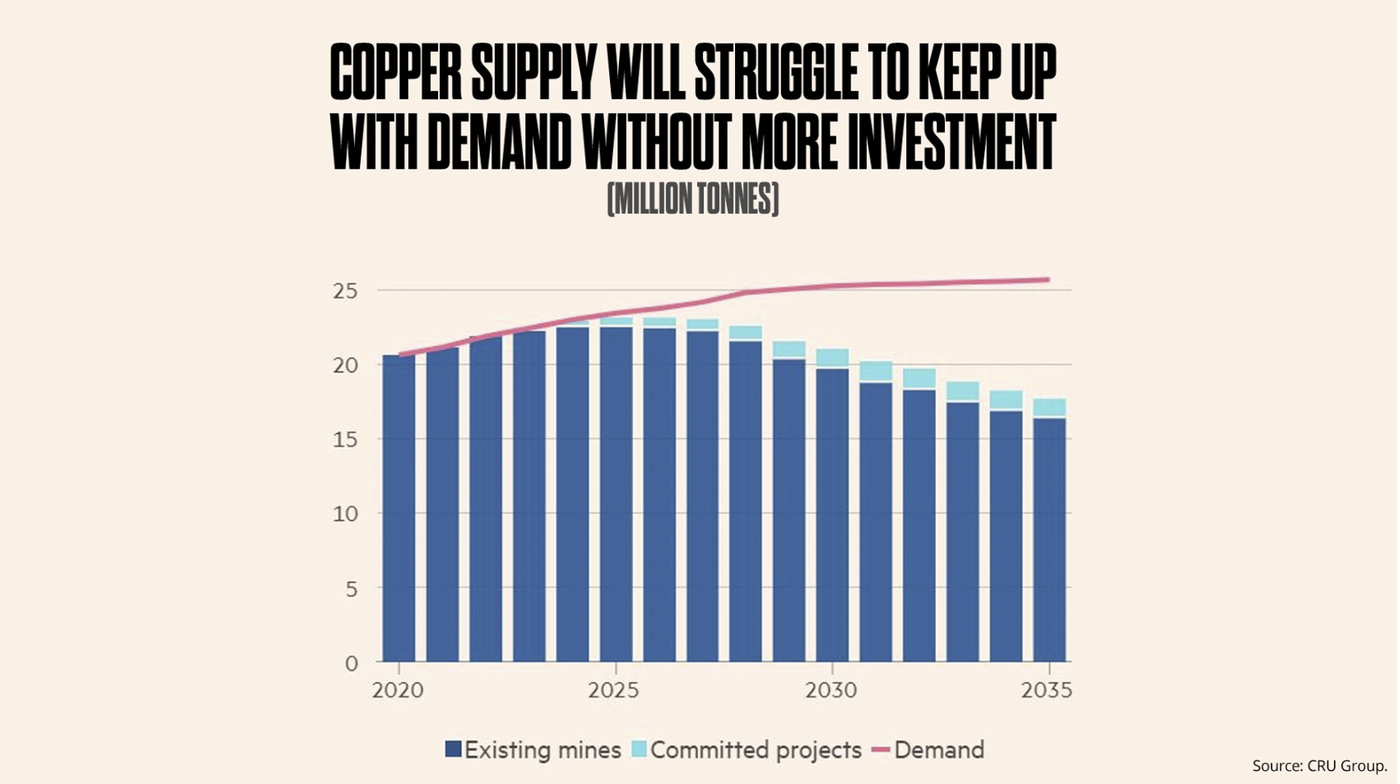
Meanwhile, demand for copper will keep rising as the world keeps growing demand for electricity. The world is staring at a supply deficit for years to come as you can see from the chart below.
Copper supply vs. demand (million tonnes)
Uranium
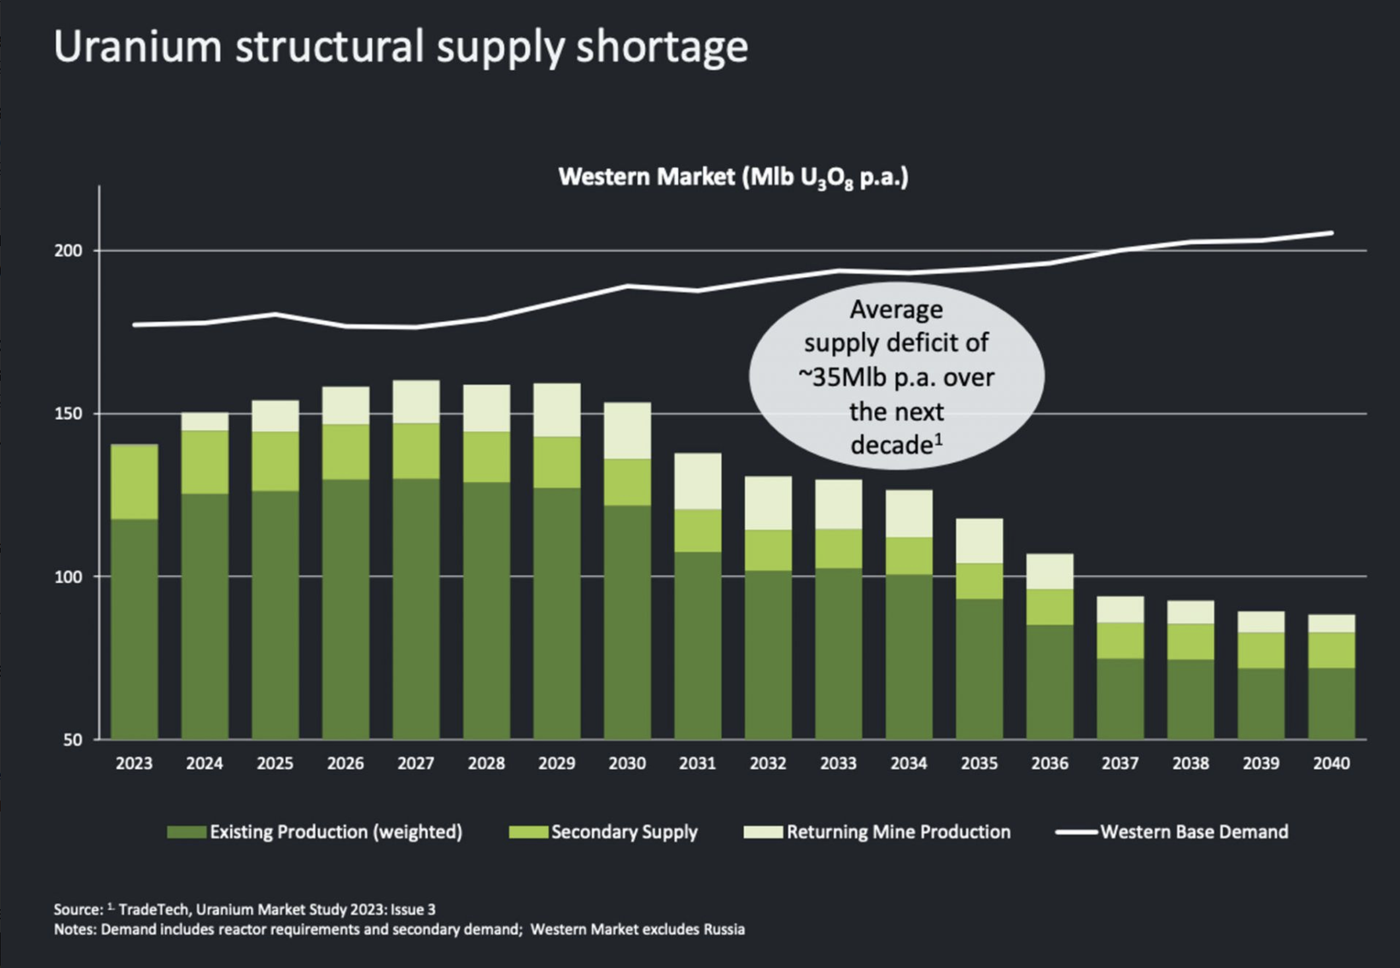
Uranium is possibly the most orphaned of all commodities. We have been living off inventories from decades ago. There was a blip higher in the 2000s when the Cigar Lake Mine had a temporary supply shock. But today we have uranium supplying mines that are 20 years older than they were in 2005 and inventories are depleted. The illustration below shows the problem: supply of uranium is already set to fall below its inelastic demand. Getting a mine into production from the time of discovering its deposit takes too long. For example, Arrow, a world class uranium deposit was discovered in 2014, but here we are 11 years later, and Arrow has still not secured its permits! Meanwhile, demand for yellow cake keeps ratcheting up as nuclear power is easily the cleanest source for base load electricity. Astonishingly, the US has a vast plug and play capacity to add nuclear reactors as the venues that currently host nuclear plants were over-engineered to add even more reactors. Throw in other major countries (China, India etc.), and there is no demand problem for yellow cake, just a supply shortfall.
Uranium structural supply shortage